Financial Highlights
-
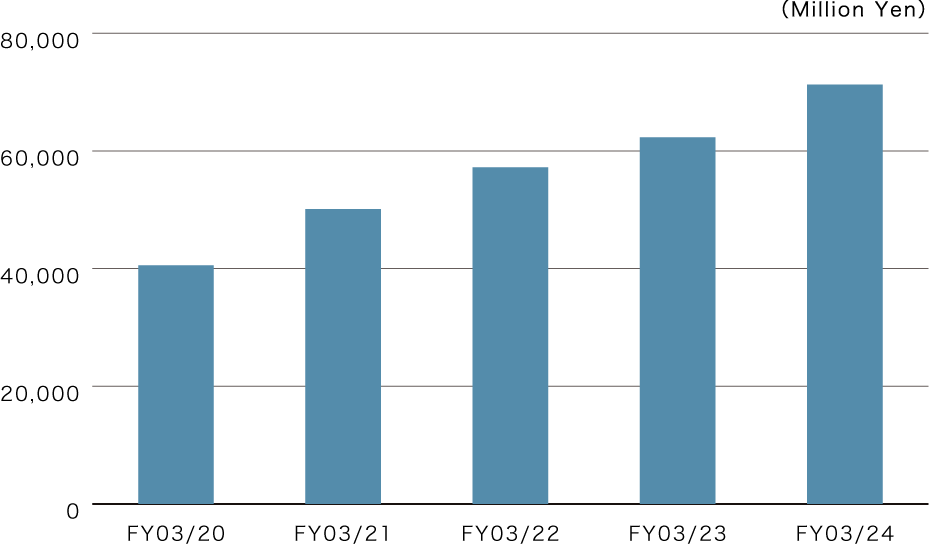
Net sales
-
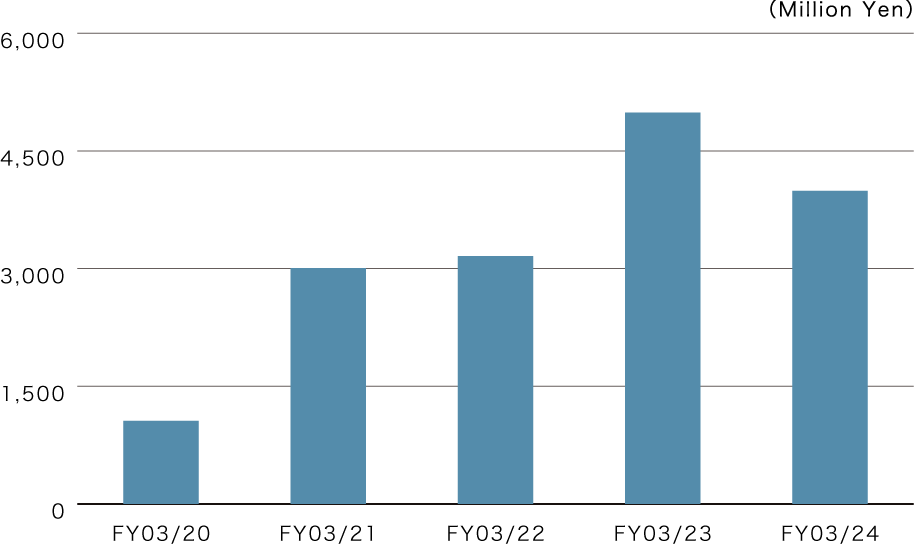
Ordinary profit
-
Profit attributable to
owners of parent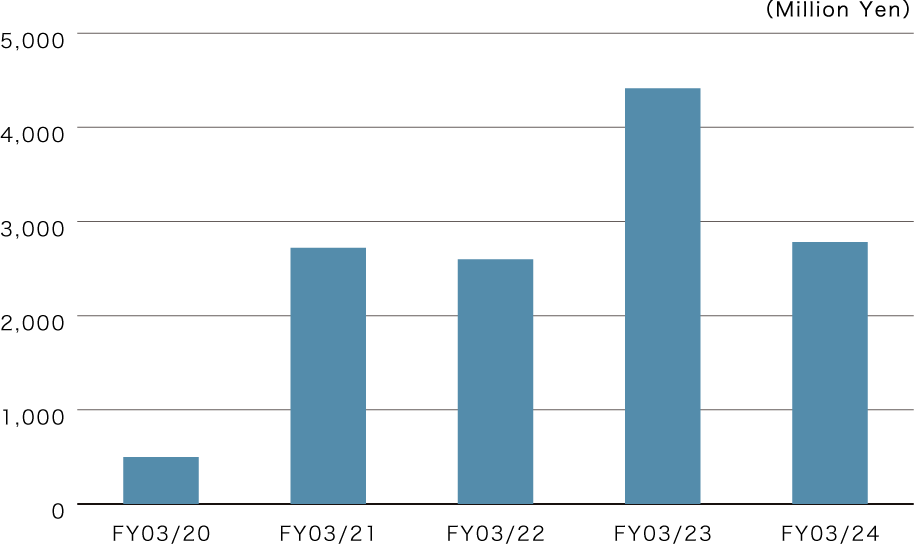
-
Ordinary profit margin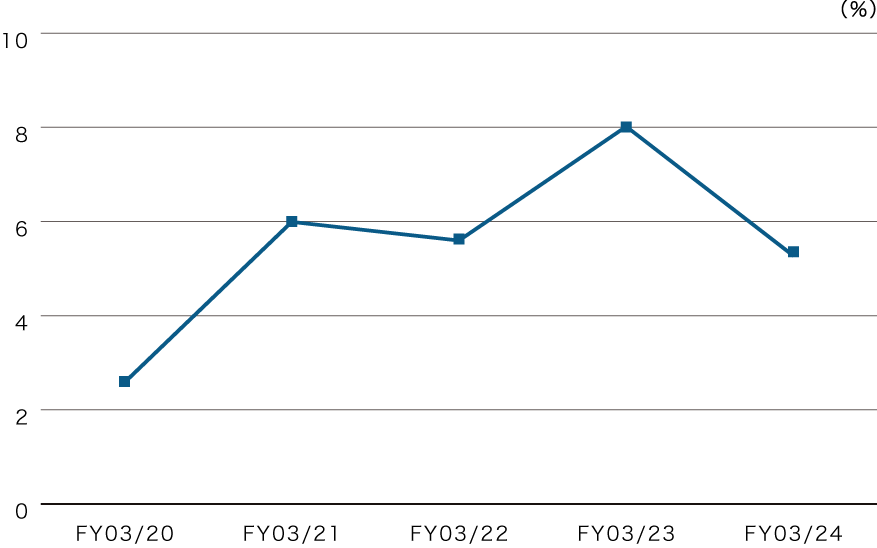
-
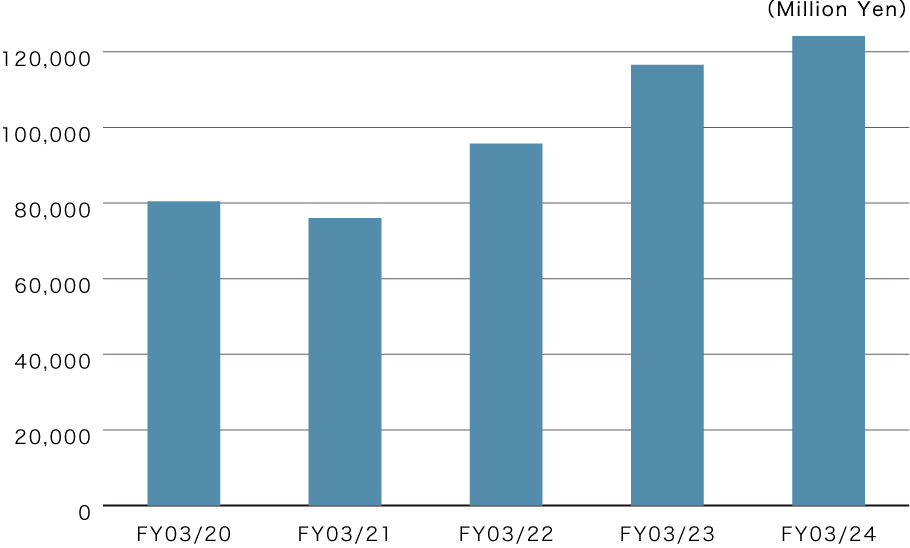
Total assets
-
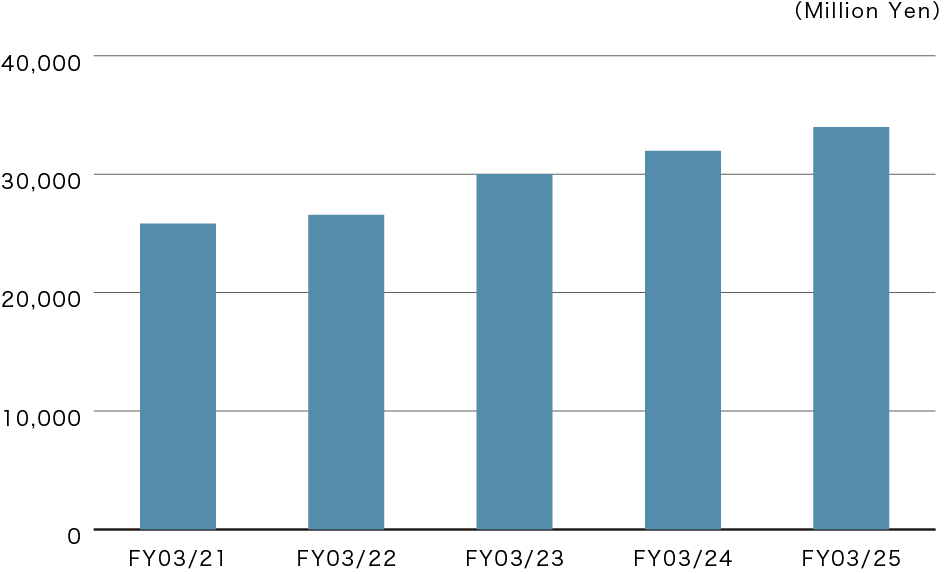
Net assets
-
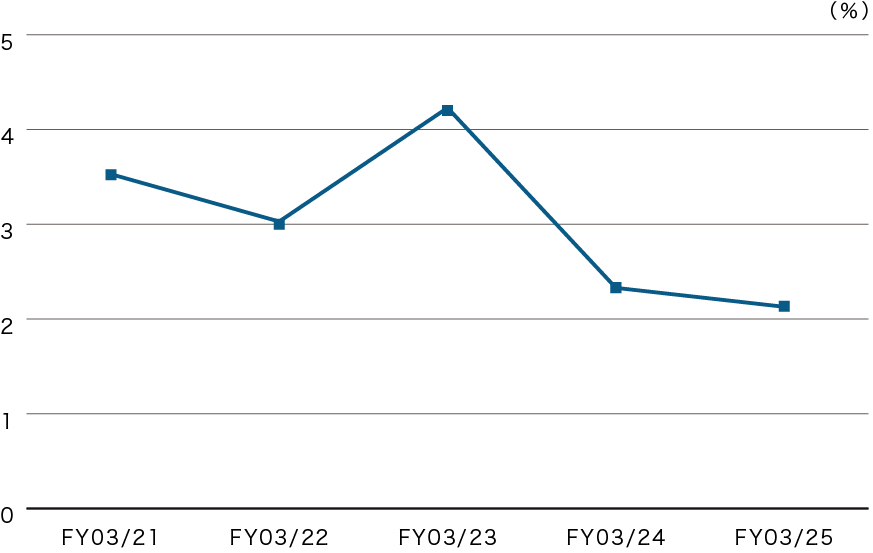
ROA
-
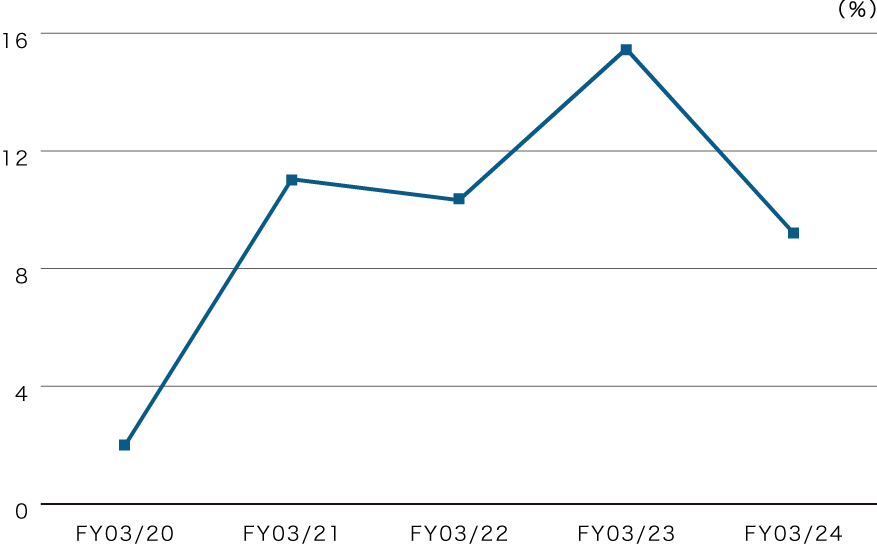
ROE
| FY03/21 | FY03/22 | FY03/23 | FY03/24 | FY03/25 | |
|---|---|---|---|---|---|
| Net sales | 50,109 | 57,209 | 62,319 | 71,250 | 79,902 |
| Operating profit | 3,626 | 4,169 | 5,941 | 4,973 | 5,240 |
| Ordinary profit | 3,007 | 3,160 | 4,989 | 3,990 | 3,769 |
| Profit attributable to owners of parent | 2,721 | 2,597 | 4,415 | 2,781 | 2,897 |
| Ordinary profit margin (%) | 6.0 | 5.5 | 8.0 | 5.6 | 4.7 |
| Profit margin (%) | 5.4 | 4.5 | 7.1 | 3.9 | 3.6 |
| Total assets | 76,051 | 95,708 | 116,538 | 124,151 | 152,097 |
| Net assets | 25,818 | 26,568 | 29,998 | 31,973 | 33,979 |
| ROA (%) | 3.5 | 3.0 | 4.2 | 2.3 | 2.1 |
| ROE(%) | 11.0 | 9.9 | 15.6 | 9.0 | 8.8 |
| Equity ratio (%) | 34.0 | 27.8 | 25.7 | 25.8 | 22.3 |
| Annual dividend per share(Yen) | 35.00 | 35.00 | 45.00 | 40.00 | 40.00 |
| Total amount of dividends | 871 | 820 | 1,055 | 937 | 937 |
| Dividend payout ratio (%) | 32.0 | 31.8 | 23.9 | 33.7 | 32.4 |
Cautions for use
・In the event of the announcement of revisions to financial statements, etc., the information in this data will not be immediately reflected.
・The information in this data is based on the financial statements.
・Although every care has been taken in converting data for publication, please note that errors may still occur due to human falsification by third parties, mechanical defects caused by malfunctioning equipment, or other force majeure.
Please note that there is a possibility that information may contain errors due to human falsification by third parties, mechanical defects caused by malfunctioning equipment, or other force majeure.
・For more detailed information on financial results, please refer to the financial statements and other documents.